Tag: infographic
-
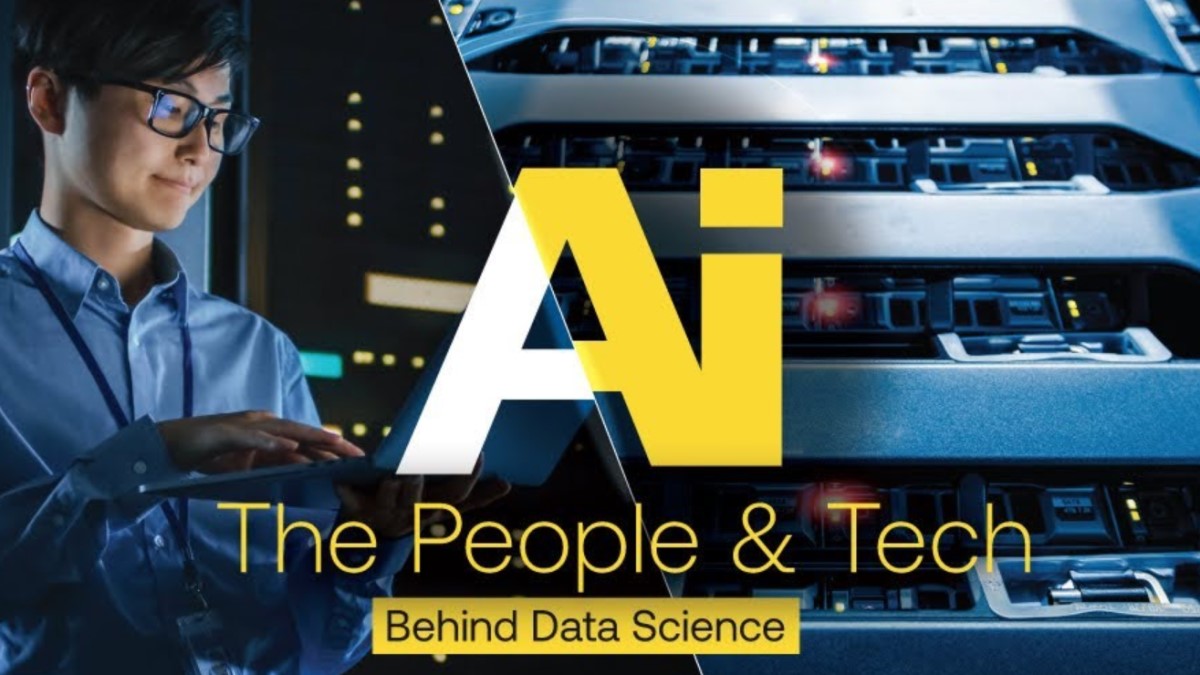
The tech and people of AI
The tech and people of AI are presented nicely in this infographic. There is tons of information in here, so take your time. Plus, leave a comment with any details you find surprising or interesting. You can also find more infographics at Visualistan Also, Data Science 101 has posted many other data-specific infographics.
-

Typical Data Scientist 2019
Data Science 365 conducts a study to determine some of the characteristics of a “typical data scientist.” This infographic covers the findings.
-
The Data Science Industry: Who Does What
The fine folks at DataCamp, a great site for learning data science right in your browser, have come up with another great infographic. This time it compares some of the many job titles in the data science field. The infographic lays out the roles and skills needed for the following job titles. Note: not all…
-
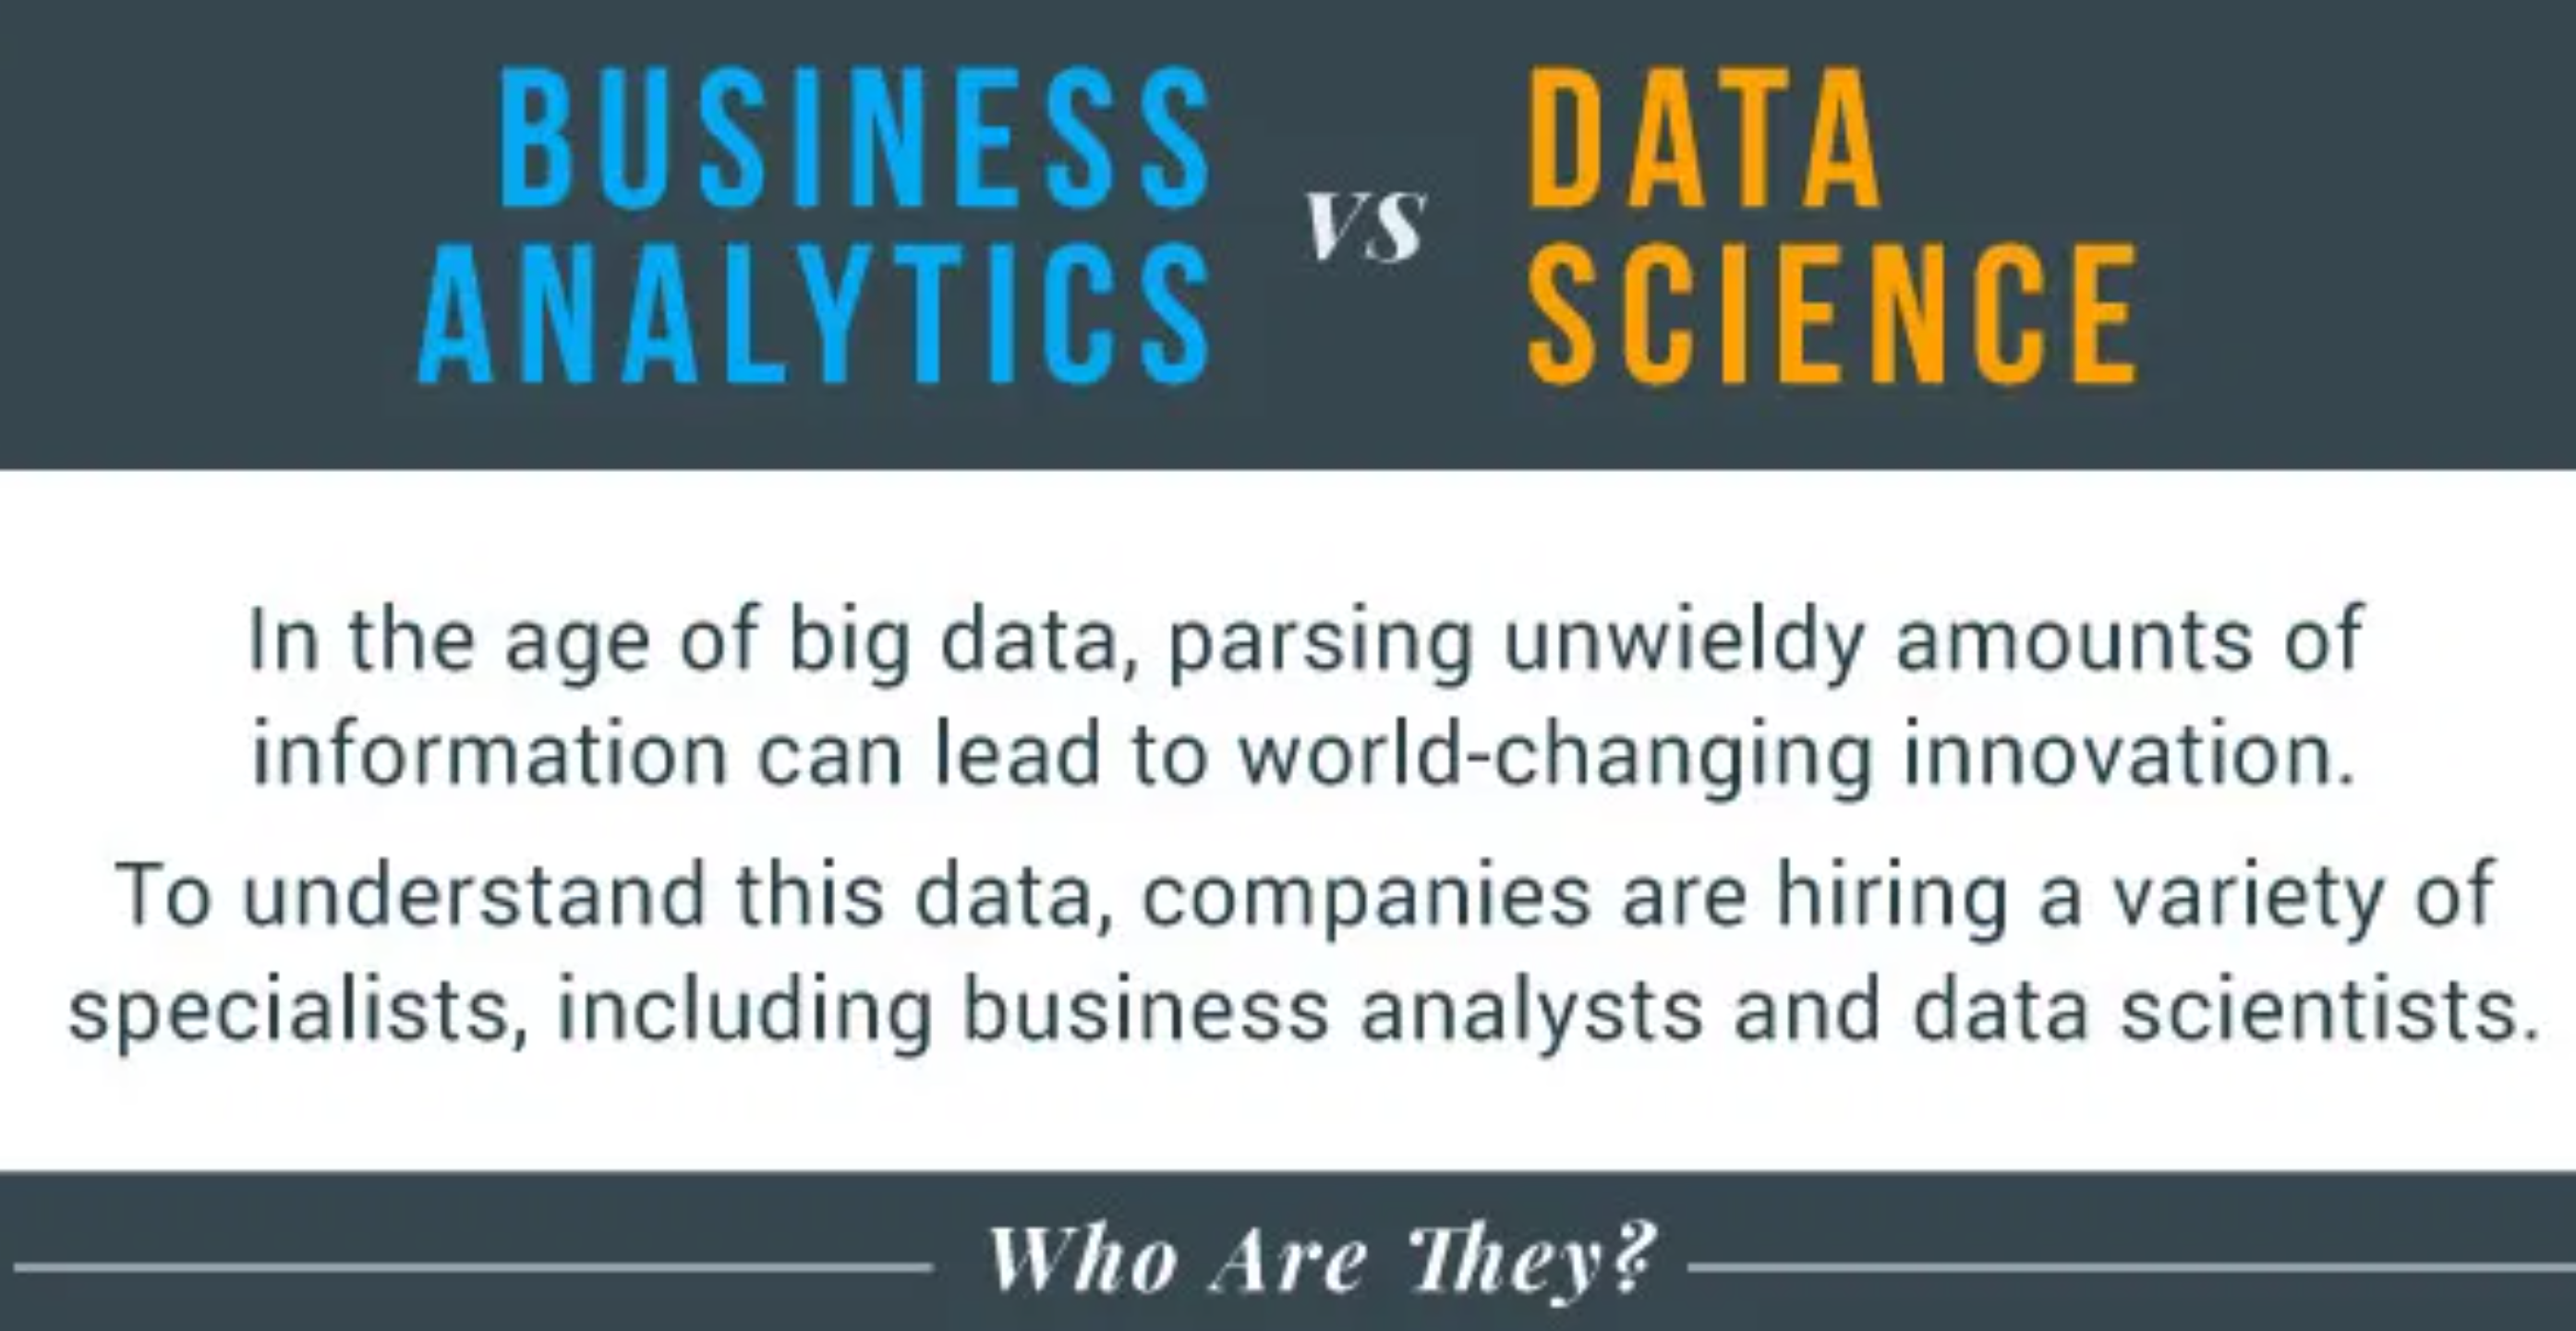
Analytics vs Data Science
The lines between analytics and data science can definitely be very blurry. Different companies might call the same position by two different names, but at their core, they do have some differences. Below is an infographic from the faculty of the Online MS in Analytics at American University. I think the infographic is accurate. In…
-
Historic Data Visualizations [Infographic]
Data Visualization is not new. Check out this historical collection of 11 visualizations.
-
Data Science Wars: R vs. Python
The great team over at DataCamp, an online site for learning R , has put together another wonderful infographic. This time, the topic is Data Science Wars (R versus Python). This has been a rather hot topic for quite some time. I even wrote about the debate back in 2013, R vs Python, The Great…
-
Big Data Startup Investments [Infographic]
This infographic is packed with good data. I especially enjoyed the section about big data startups that were acquired in 2013. Courtesy of: BigData-Startups
-
Data Size Matters Infographic
Here is a great infographic from Data Science @ Berkeley. Just how big is a Gigabyte(GB)? Be sure to look all the way to the bottom. It mentions/explains a few of the latest innovations in hard drives, for example: helium, SMR, HAMR. You will have to scroll to the bottom to see what those acronyms…
-
Infogr.am – Awesome Interactive Infographics
Inforgr.am is a website for creating interactive infographics. Strangely, the site is new to me even though nearly 1 million “infograms” have already been created. Here are some of the features: Use more than 30 different chart types Edit data with a built-in spreadsheet Download the infographic Share on all your favorite social sites Some…
-
Facebook dominates Social Networking
The Real Data on Facebook vs. Google+ is a great article about the popularity of different social networks. All the big social networks (Twitter, Facebook, Google+, LinkedIn, Pinterests, and even Myspace) are included. If you have ever wondered whether Google+ is dead or not, this article will help you out. After the data was gathered…
-
A Big Data Infographic
This infographic explains the Three V’s of big data, contains a nice list of analytical techniques, related trends and some other information. Big Data Snapshot infographic
-
Pizza Delivery: A video Infographic
This is a video infographic about pizza delivery in Manhattan. This is another good way to make data tell a story.